Home Lab Monitoring with Prometheus, Loki, Alloy and Grafana
Set up a lightweight observability stack using Prometheus, Loki, and Alloy for metrics and log collection, all visualised in Grafana. This home lab guide focuses on simplicity, minimal config, and quick deployment with Docker Compose—helping you monitor containerised applications effortlessly.

Introduction
Observability is crucial in any modern infrastructure, whether you're managing cloud-native applications or running services in a home lab. With the right tools, you can monitor metrics and aggregate logs to diagnose issues.
In this guide, we’ll set up Prometheus for metrics collection, Loki for log aggregation, and Alloy as a unified data pipeline. We’ll also use Grafana to query and visualise everything. By the end, you'll have a fully functional observability stack for your containerised applications.
This guide is part of my home lab series, where I document my journey in building a lightweight testing environment to experiment and learn without unnecessary complexity. If you’re new to my project, I recommend starting with my first article, where I lay out the foundation of my setup.

Inspiration & References
The configuration presented in this guide is inspired by various open-source projects. In particular:
- Showcasing Grafana Alloy – Extensive Alloy configuration with the Grafana stack.
- Grafana Workshop Material – Nice examples of docker integration.
These resources helped form my own setup, and I highly recommend checking them out for alternative approaches or deeper insights.
Table of Contents
- Goals and Limitations
- Initialising the Project
- Setting Up Prometheus
- Adding Loki for Log Aggregation
- Configuring Alloy for Data Collection
- Setting Up Grafana for Visualisation
- Running the Observability Stack
- Conclusion
Goals and Limitations
Goals
For this project, the objective is to:
✅ Collect logs and metrics from my running containers.
✅ Keep the setup minimal and lightweight.
✅ Use configurations that require low maintenance.
Limitations
To keep things simple, the following constraints apply:
⚠ No persistence – Data is lost on container restart.
⚠ No authentication – Services are accessible without credentials.
⚠ Only container metrics – No application-level instrumentation.
⚠ All containers are included – No selective labelling or filtering.
This is not a production-ready setup but rather a starting point to learn how these tools work together. The focus is on how to set them up, not why to use them in production.
Initialise the Project
Checkout my home lab repo to follow along of create your own!
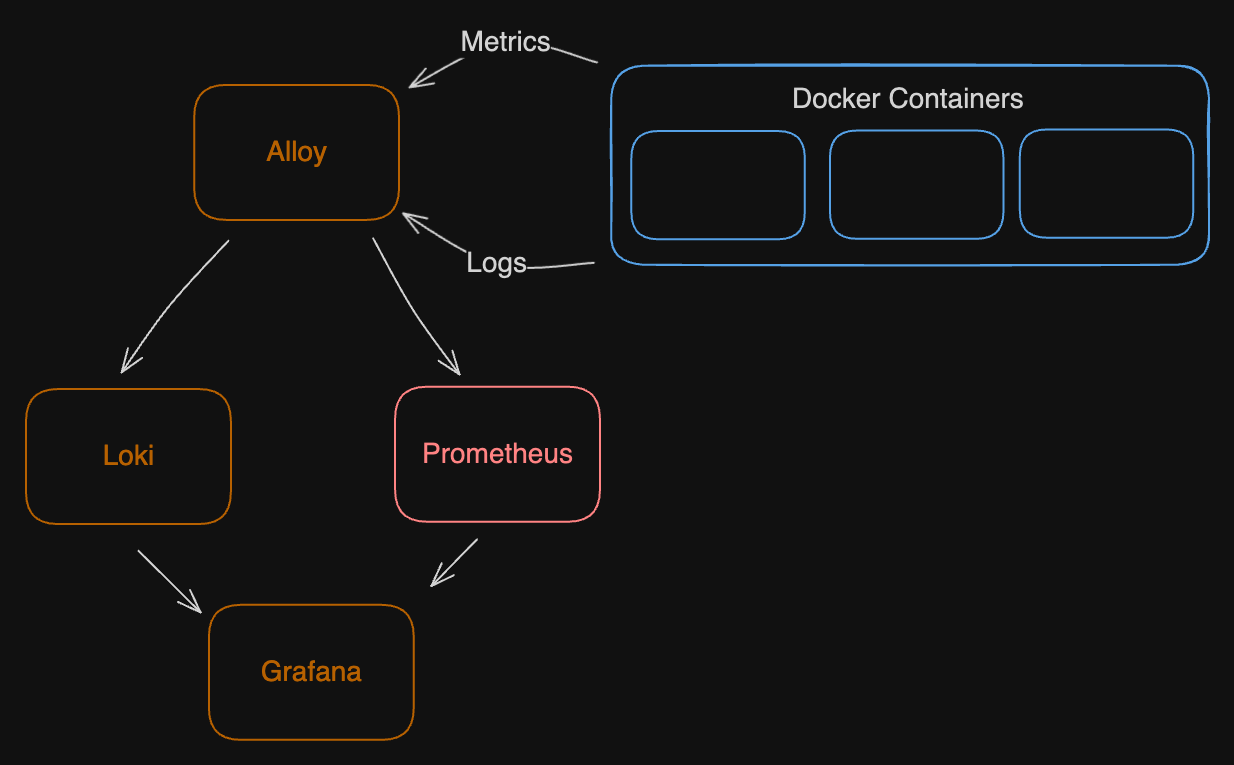
Below is a simple diagram illustrating how the observability stack components interact. Alloy collects both logs and metrics from the running containers and sends them to Loki and Prometheus. Grafana then queries these data sources for visualisation.
To begin, create a new directory to hold all observability-related configurations:
mkdir observability && cd observability
touch docker-compose.yaml
Project Initialisation
This will keep all configuration files organised in a single location.
Prometheus
Prometheus is responsible for collecting and storing metrics from running containers. Add the following configuration to your docker-compose.yaml:
services:
  prometheus:
    container_name: prometheus
    image: prom/prometheus:latest
    ports:
      - "9090:9090"
    command:
      - --config.file=/etc/prometheus/prometheus.yml
Prometheus Configuration in Docker Compose
Explanation
container_name: Names the containerprometheusfor easy identification.image: Pulls the latest version of Prometheus.ports: Maps port 9090 from the container to the host, making the Prometheus UI accessible.command: Specifies the path to the Prometheus configuration file.
Since we're not mounting a configuration file, Prometheus will start with its default settings. We do how ever need to specify where the config file is located.
Loki
Loki is a log aggregation system that efficiently stores and queries logs. Add this to docker-compose.yaml:
  loki:
    container_name: loki
    image: grafana/loki:latest
    ports:
      - "3100:3100"
Loki Configuration in Docker Compose
Explanation
container_name: Names the containerloki.image: Uses the latest Loki version.ports: Maps Loki’s 3100 port for external access.
Loki will be used as the destination for logs collected from all running containers.
Alloy
Alloy serves as the telemetry pipeline, collecting and forwarding logs and metrics to Loki and Prometheus. Add the following configuration:
  alloy:
    container_name: alloy
    image: grafana/alloy:latest
    volumes:
      - ./alloy:/etc/alloy/
      - /var/run/docker.sock:/var/run/docker.sock
    command:
      - run
      - /etc/alloy/config.alloy
      - --server.http.listen-addr=0.0.0.0:12345
Alloy Configuration in Docker Compose
Explanation
contaner_name: Names the containeralloy.image: Uses the latest Alloy image.volumes:- Mounts
./alloyto/etc/alloy/, where the config file will be stored. - Mounts the Docker socket, allowing Alloy to discover running containers.
- Mounts
command:runstarts Alloy./etc/alloy/config.alloyspecifies the configuration file.--server.http.listen-addr=0.0.0.0:12345makes the Alloy HTTP server accessible.
ports: I chose to omit ports but if you would like to view the alloy ui you can provide a config for that under ports.12345:12345is normally used for accessing Alloy.
Configuring Alloy
Alloy uses a plain text configuration format, defined in a config.alloy file. This file determines what data to collect and where to send it.
Start by creating the configuration file:
mkdir alloy && touch alloy/config.alloyCreating Alloy Configuration File
For this guide, Alloy will be configured to collect logs and container metrics. Alloy provides different components for data collection. Here, we’ll use:
discovery.docker– To detect running Docker containers.discovery.relabel– To modify and add labels to collected data.loki.source.docker&loki.write– To send logs to Loki.prometheus.exporter.cadvisor&prometheus.remote_write– To collect and send metrics to Prometheus.
Collecting Logs
To collect logs from all running Docker containers, Alloy needs to identify them. The discovery.docker component accomplishes this by pointing to the Docker socket on the host machine:
discovery.docker "linux" {
  host = "unix:///var/run/docker.sock"
}
Alloy Docker Discovery
By default, Alloy assigns metadata to discovered containers, but we can enhance this using discovery.relabel. This step adds a custom label called service_name, which extracts the container name from the __meta_docker_container_name label.
discovery.relabel "logs_integrations_docker" {
  targets = []

  rule {
    source_labels = ["__meta_docker_container_name"]
    regex = "^/?(.*)$"
    target_label = "service_name"
  }
}
Alloy Relabelling for Logs
This ensures logs are tagged with a human-readable service_name, making it easier to filter and analyse data later.
Forwarding Logs to Loki
Now that Alloy can discover and tag logs, we need to forward them to Loki.
loki.source.dockercollects logs from running containers.loki.writesends the logs to the Loki service.
loki.source.docker "docker_logs" {
  host          = "unix:///var/run/docker.sock"
  targets       = discovery.docker.linux.targets
  labels        = {"platform" = "docker"}
  relabel_rules = discovery.relabel.logs_integrations_docker.rules
  forward_to    = [loki.write.loki.receiver]
}

loki.write "loki" {
  endpoint {
    url = "http://loki:3100/loki/api/v1/push"
  }
}
Alloy Configuration for Loki
Since all services in this setup share a Docker network, we can refer to Loki by its container name (loki) instead of an IP address.
Collecting Metrics
For container performance monitoring, we use prometheus.exporter.cadvisor, which collects metrics like CPU usage, memory consumption, and network activity from all running containers.
prometheus.exporter.cadvisor "docker_metrics" {
  docker_host       = "unix:///var/run/docker.sock"
  storage_duration  = "5m"
}
Alloy Configuration for Prometheus Metrics Collection
This configuration connects to the Docker daemon and retains metric data for 5 minutes before discarding old values.
Scraping and Forwarding Metrics to Prometheus
Next, we configure Prometheus to scrape the metrics collected by cadvisor and forward them to our Prometheus instance:
prometheus.scrape "scraper" {
  targets         = prometheus.exporter.cadvisor.docker_metrics.targets
  forward_to      = [prometheus.remote_write.prometheus.receiver]
  scrape_interval = "10s"
}

prometheus.remote_write "prometheus" {
  endpoint {
    url = "http://prometheus:9090/api/v1/write"
  }
}
Alloy Scraping and Forwarding Metrics to Prometheus
prometheus.scrapecollects container metrics every 10 seconds.prometheus.remote_writeensures these metrics are sent to Prometheus.
Setting Up Grafana
Grafana provides a visualisation layer for logs and metrics. Add this to docker-compose.yaml:
  grafana:
    container_name: grafana
    image: grafana/grafana:latest
    ports:
      - "3000:3000"
    environment:
      - GF_LOG_LEVEL=debug
    volumes:
      - ./grafana/provisioning/datasources:/etc/grafana/provisioning/datasources
Grafana Configuration in Docker Compose
Explanation
container_name: Names the containergrafana.image: Uses the latestgrafanaimage.ports: Maps Grafana’s web interface to port 3000.environment: Sets log level todebug.volumes: Auto-configures data sources on startup.
Configuring Grafana
Create the provisioning config file at this path:
mkdir -p grafana/provisioning/datasources && touch grafana/provisioning/datasources/datasource.yamlCreating Grafana Data Source Configuration File
apiVersion: 1

datasources:
  - name: Loki
    type: loki
    access: proxy
    url: http://loki:3100
    basicAuth: false

  - name: Prometheus
    type: prometheus
    access: proxy
    url: http://prometheus:9090
    basicAuth: false
Configuring Data Sources in Grafana
Running the Applications
Start everything with:
docker compose up -dStarting the Observability Stack
Access Grafana at http://localhost:3000 (login: admin/admin).
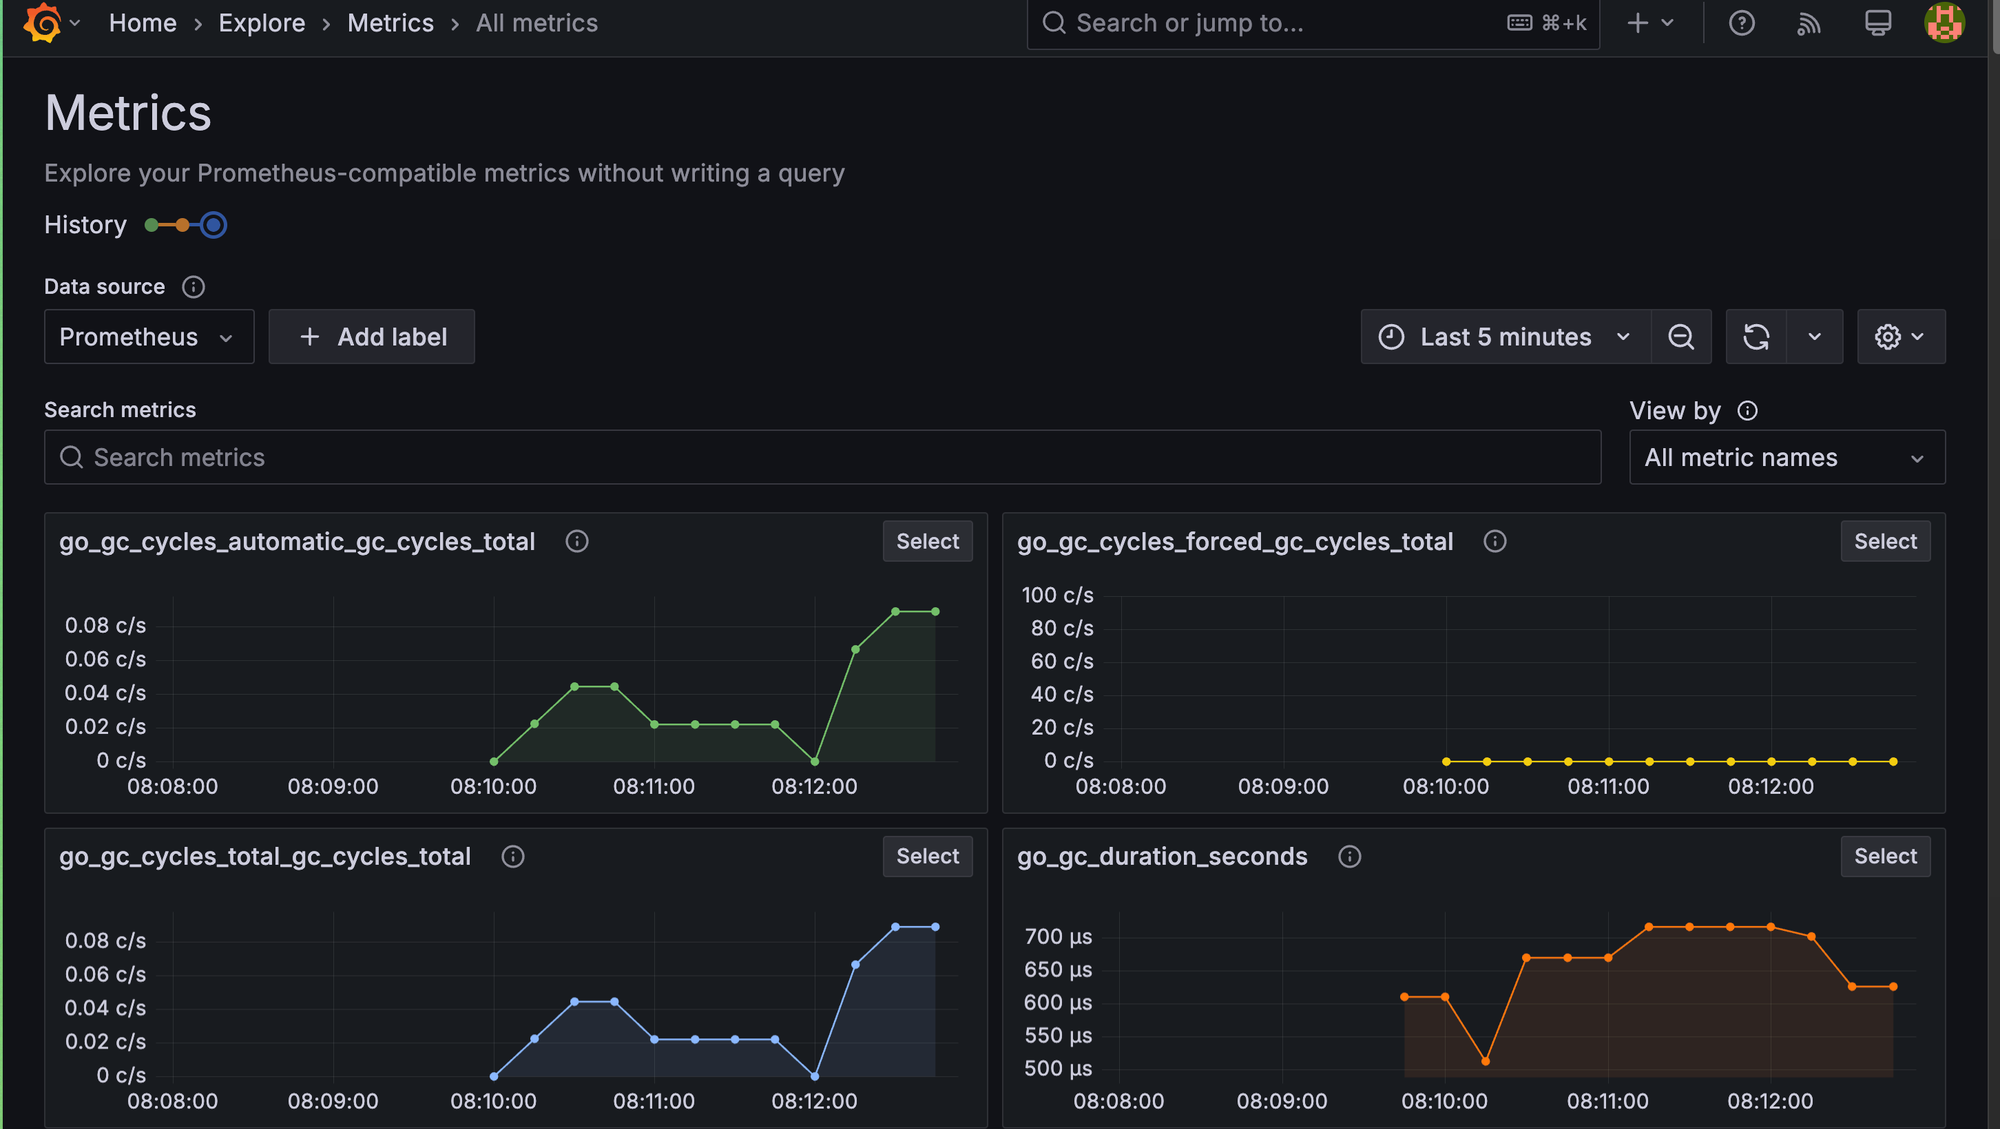
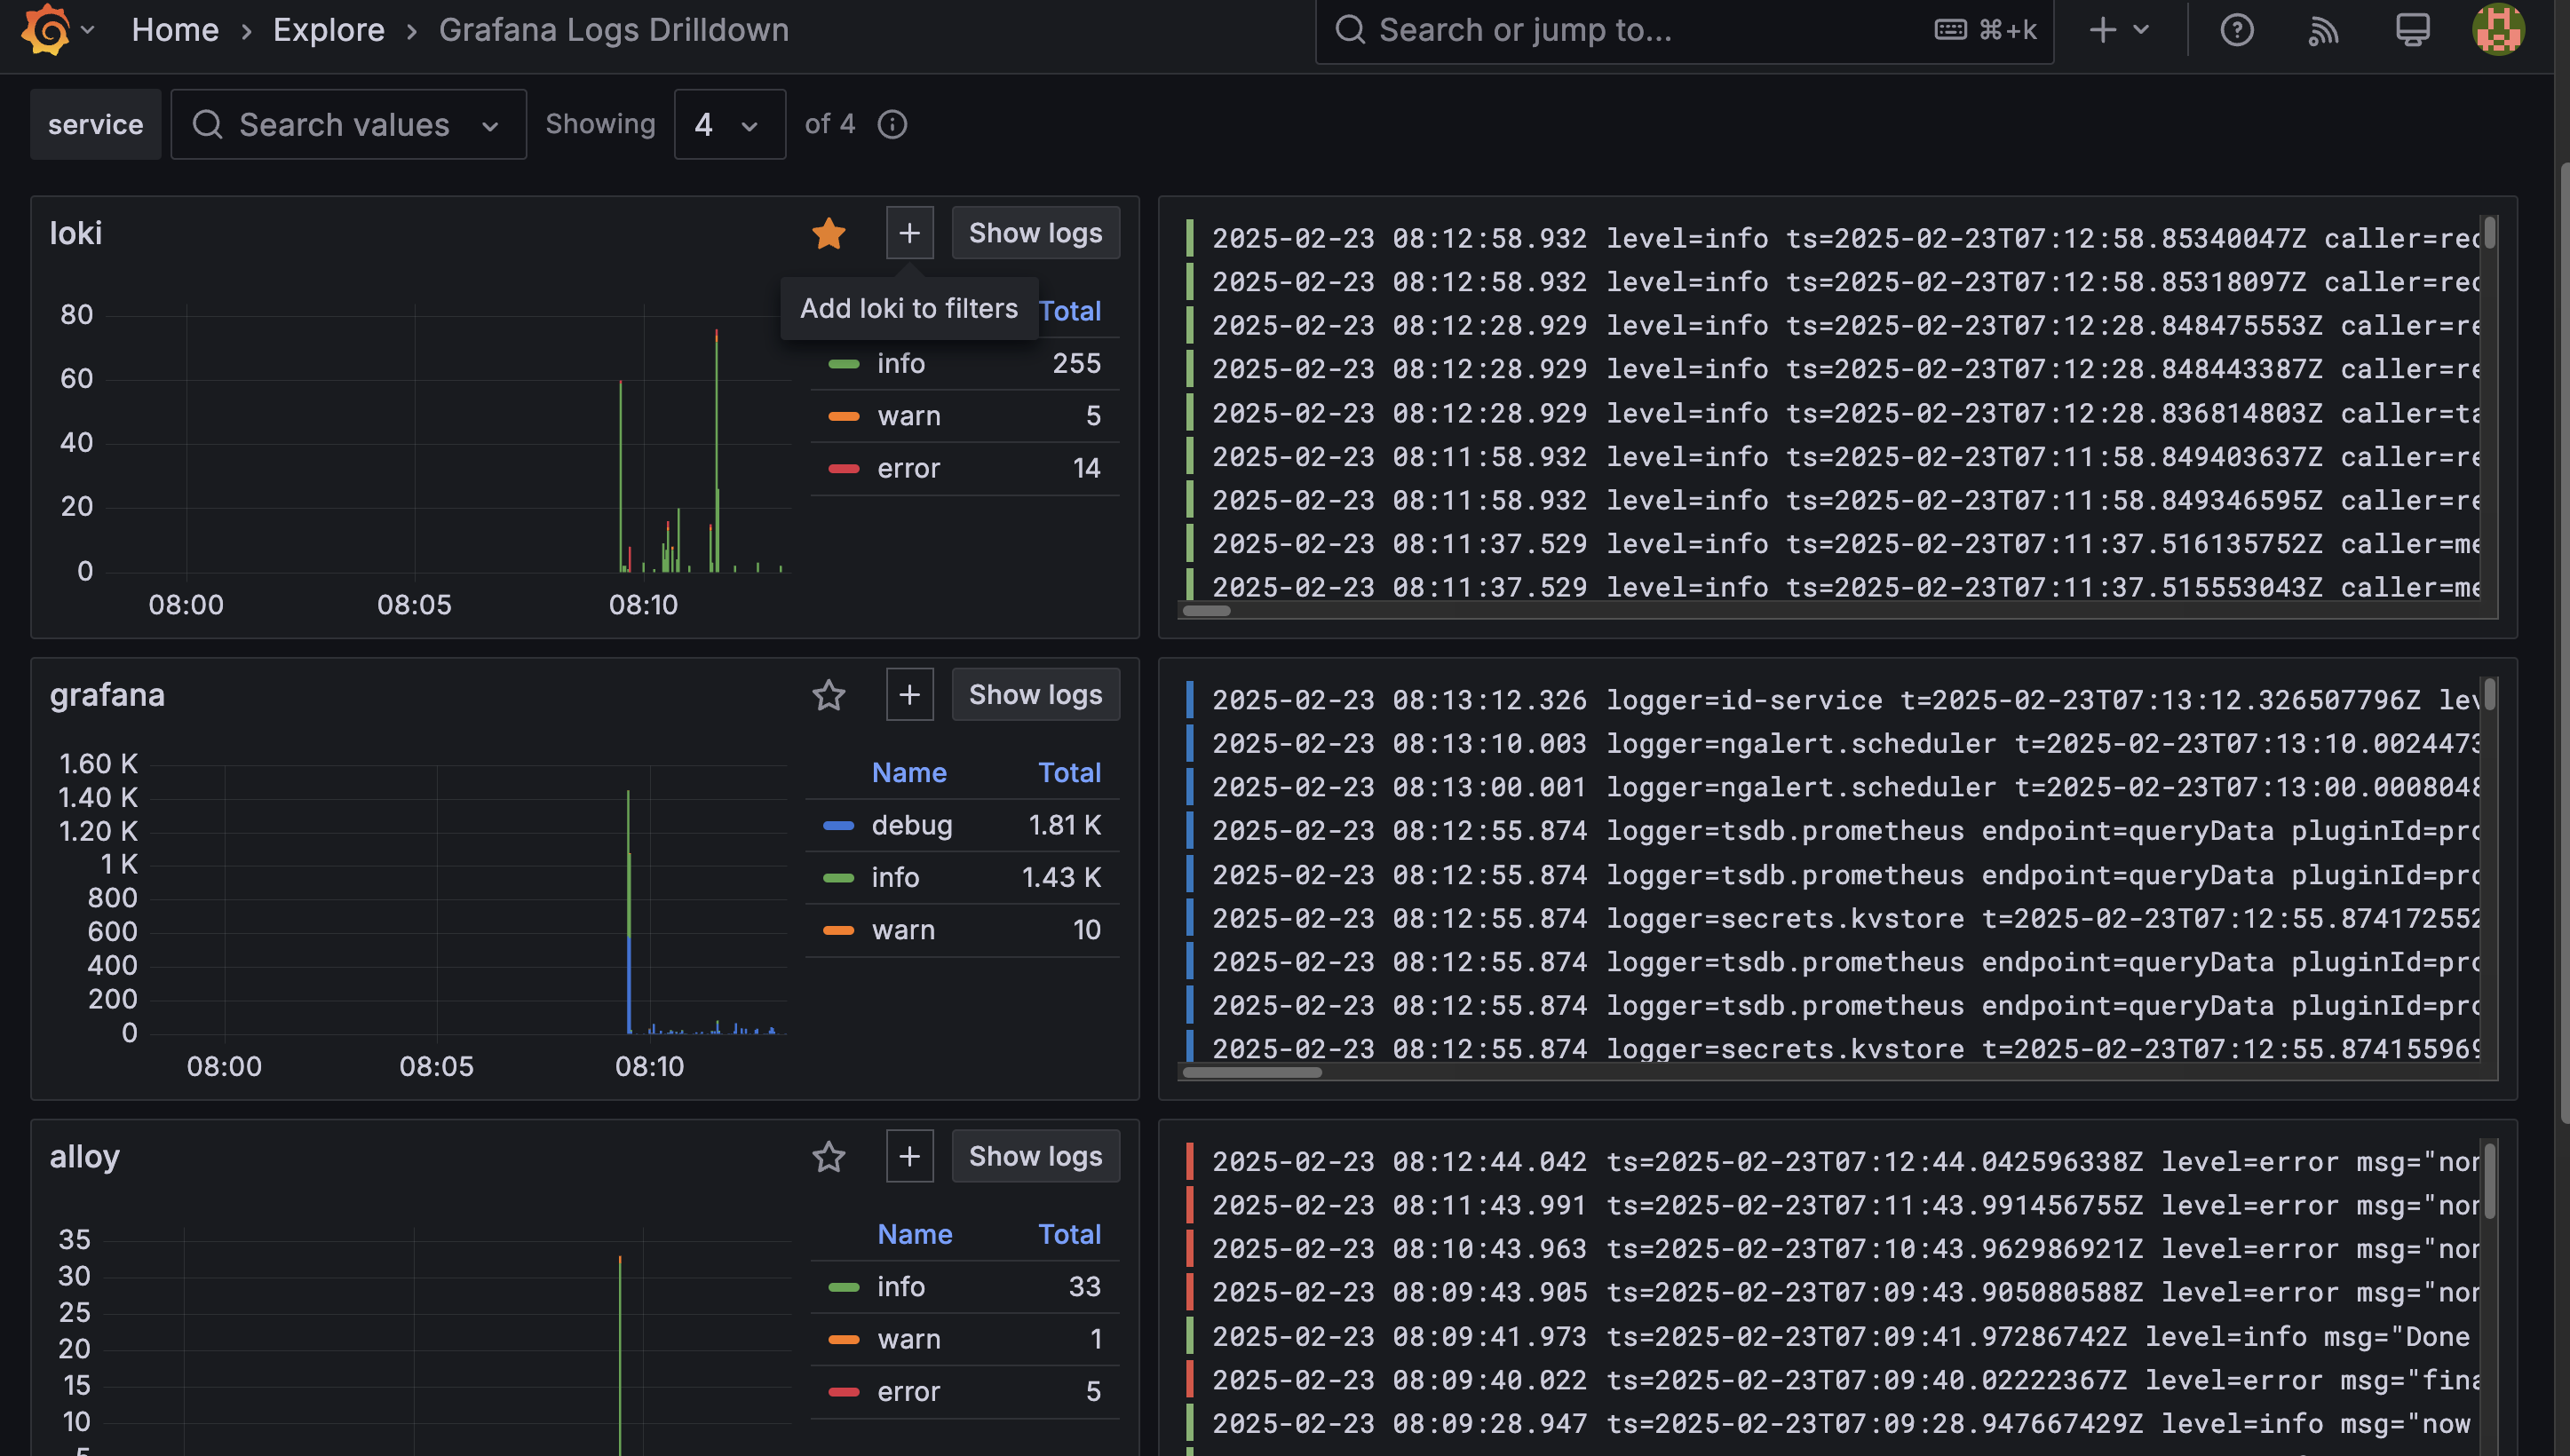
Once the observability stack is up and running, you can open Grafana in your browser and visualise the data sources. Below is an example of container metrics and logs from my deployment.
Conclusion
With this setup, you now have a fully functional observability stack for your home lab, capable of collecting logs and metrics from your containers. By integrating Prometheus, Loki, Alloy, and Grafana, you've created a streamlined system that enables monitoring, visualisation, and troubleshooting—all with minimal configuration.
While this guide is tailored for a lightweight home lab setup, it provides a foundation for observability in more advanced environments. If you plan to extend this for production use, consider adding persistence, authentication, and more refined configurations to tailor the setup to your needs.
With everything running, you can now visualise your containerised applications. Happy monitoring! 🚀